> ## Documentation Index
> Fetch the complete documentation index at: https://docs.aevyra.ai/llms.txt
> Use this file to discover all available pages before exploring further.
# Dashboard
> The local web UI for browsing runs, inspecting iteration traces, reading prompt diffs, and branching new experiments from any iteration.
Start the dashboard from your project directory:
```bash theme={null}
aevyra-reflex dashboard
```
This starts a local server (default port 8128) and opens the UI in your browser.
The page reads directly from `.reflex/runs/` — reload manually to pick up new runs.
***
## Runs Dashboard
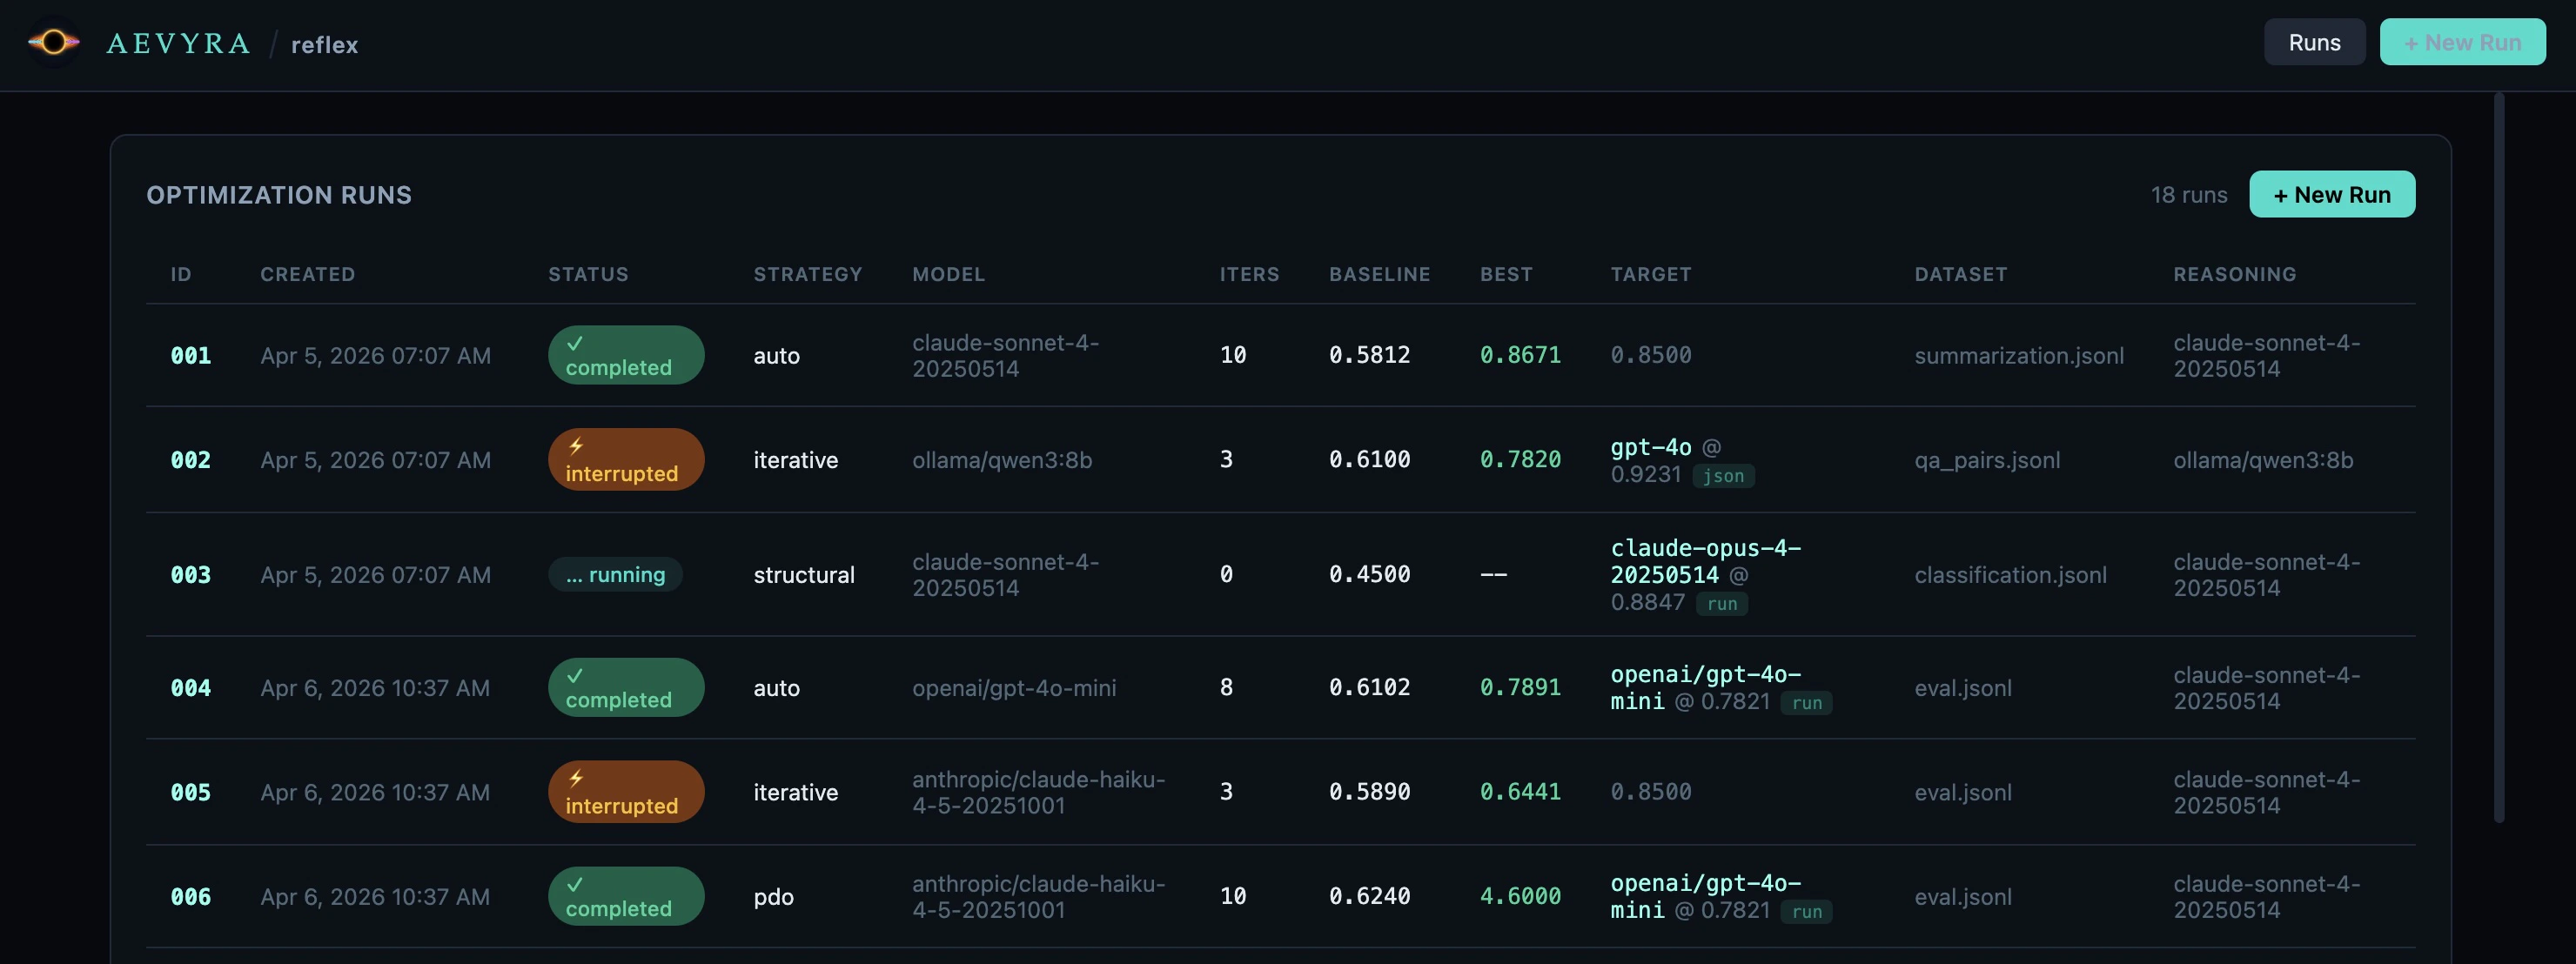
The landing screen lists every optimization run stored in `.reflex/runs/`, most
recent first. Click any row to open its detail view.
 ### Columns
| Column | Description |
| ------------- | ----------------------------------------------------------------------------------------------------- |
| **ID** | Numeric run identifier (e.g. `001`). Branch runs show a `└─` connector and an `⎇ parent/iter` badge. |
| **Created** | Timestamp the run was started, derived from the directory name. |
| **Status** | `completed`, `interrupted`, or `running`. |
| **Strategy** | The optimization strategy used: `auto`, `iterative`, `structural`, `fewshot`, or `pdo`. |
| **Model** | Target model(s) being optimized, as passed with `-m` on the CLI. |
| **Iters** | Number of iterations completed. |
| **Baseline** | Mean score before any optimization. |
| **Best** | Highest mean score reached. Shown in green. |
| **Target** | If no verdict: the `score_threshold` from config. If verdict: `target_model @ threshold [json\|run]`. |
| **Dataset** | Dataset filename. Click to expand and reveal the full absolute path. |
| **Reasoning** | Reasoning model used for optimization. |
### Branch runs in the list
Branch runs appear immediately after their parent in the runs list — not at the
bottom — so the full experiment tree stays together. A `└─` connector and an
`⎇ 003/5` badge show the parent run and the iteration it was branched from.
***
## Run Detail
Click a row to open the detail view for that run. The URL updates to
`#/runs/` so you can bookmark or share it.
### Columns
| Column | Description |
| ------------- | ----------------------------------------------------------------------------------------------------- |
| **ID** | Numeric run identifier (e.g. `001`). Branch runs show a `└─` connector and an `⎇ parent/iter` badge. |
| **Created** | Timestamp the run was started, derived from the directory name. |
| **Status** | `completed`, `interrupted`, or `running`. |
| **Strategy** | The optimization strategy used: `auto`, `iterative`, `structural`, `fewshot`, or `pdo`. |
| **Model** | Target model(s) being optimized, as passed with `-m` on the CLI. |
| **Iters** | Number of iterations completed. |
| **Baseline** | Mean score before any optimization. |
| **Best** | Highest mean score reached. Shown in green. |
| **Target** | If no verdict: the `score_threshold` from config. If verdict: `target_model @ threshold [json\|run]`. |
| **Dataset** | Dataset filename. Click to expand and reveal the full absolute path. |
| **Reasoning** | Reasoning model used for optimization. |
### Branch runs in the list
Branch runs appear immediately after their parent in the runs list — not at the
bottom — so the full experiment tree stays together. A `└─` connector and an
`⎇ 003/5` badge show the parent run and the iteration it was branched from.
***
## Run Detail
Click a row to open the detail view for that run. The URL updates to
`#/runs/` so you can bookmark or share it.
 ### Stats row
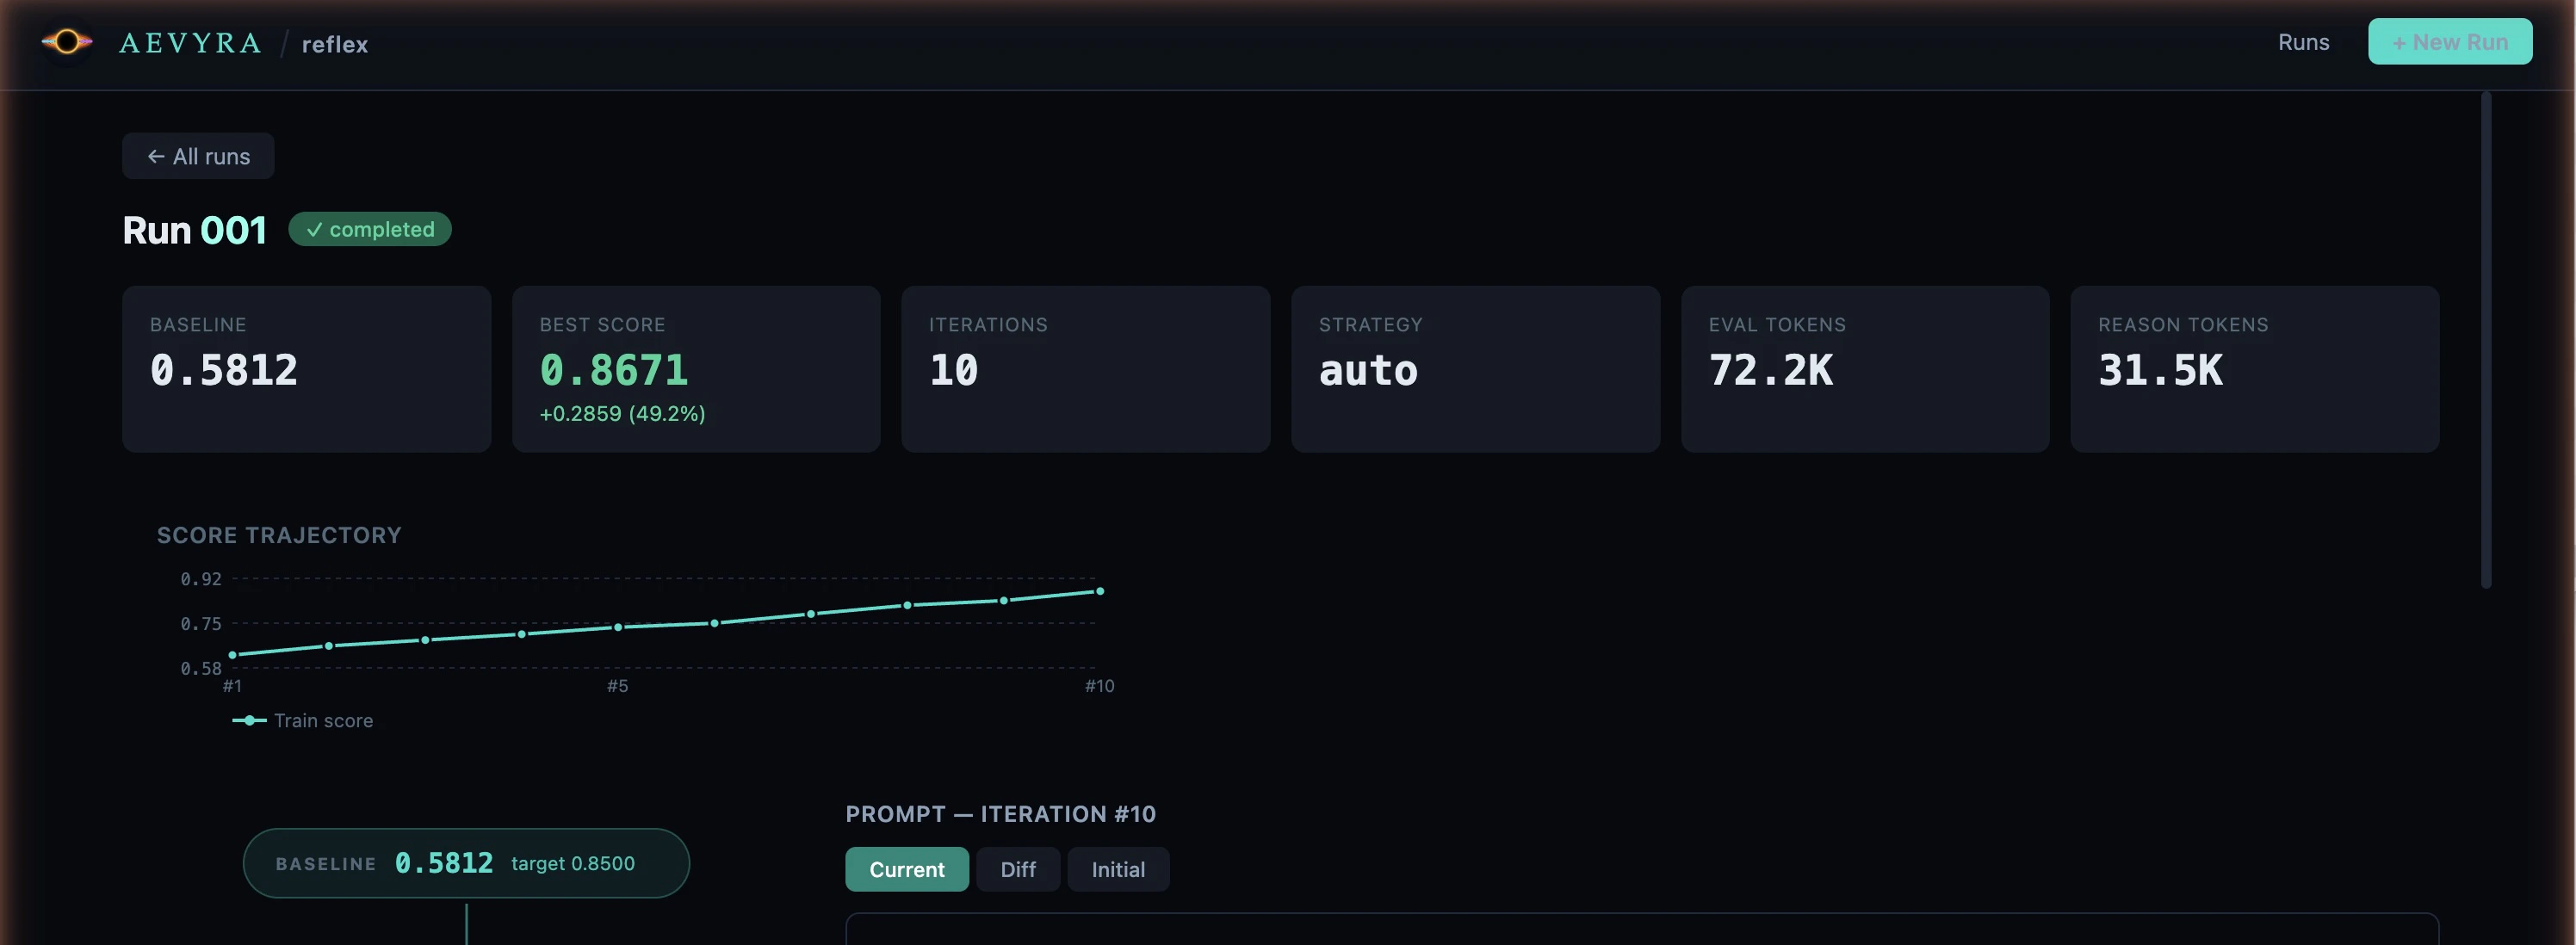
Six summary tiles appear at the top of the page:
* **Baseline** — mean score before optimization
* **Best Score** — highest score achieved, with improvement shown below (e.g. `+0.2859 / 49.2%`)
* **Iterations** — total number of iterations run
* **Strategy** — strategy used for this run
* **Eval tokens** — total tokens consumed by evaluation calls across all iterations
* **Reasoning tokens** — total tokens consumed by the reasoning model across all iterations
A **Verified** tile also appears when the final verification eval produces a
different score than the best in-run score — this can happen when a prompt
generalizes differently on the held-out verification pass.
### Flow graph
The left panel shows the full optimization trace as a top-to-bottom sequential
chain. Iterations always run sequentially — the graph reflects this with a
single vertical layout.
### Stats row
Six summary tiles appear at the top of the page:
* **Baseline** — mean score before optimization
* **Best Score** — highest score achieved, with improvement shown below (e.g. `+0.2859 / 49.2%`)
* **Iterations** — total number of iterations run
* **Strategy** — strategy used for this run
* **Eval tokens** — total tokens consumed by evaluation calls across all iterations
* **Reasoning tokens** — total tokens consumed by the reasoning model across all iterations
A **Verified** tile also appears when the final verification eval produces a
different score than the best in-run score — this can happen when a prompt
generalizes differently on the held-out verification pass.
### Flow graph
The left panel shows the full optimization trace as a top-to-bottom sequential
chain. Iterations always run sequentially — the graph reflects this with a
single vertical layout.
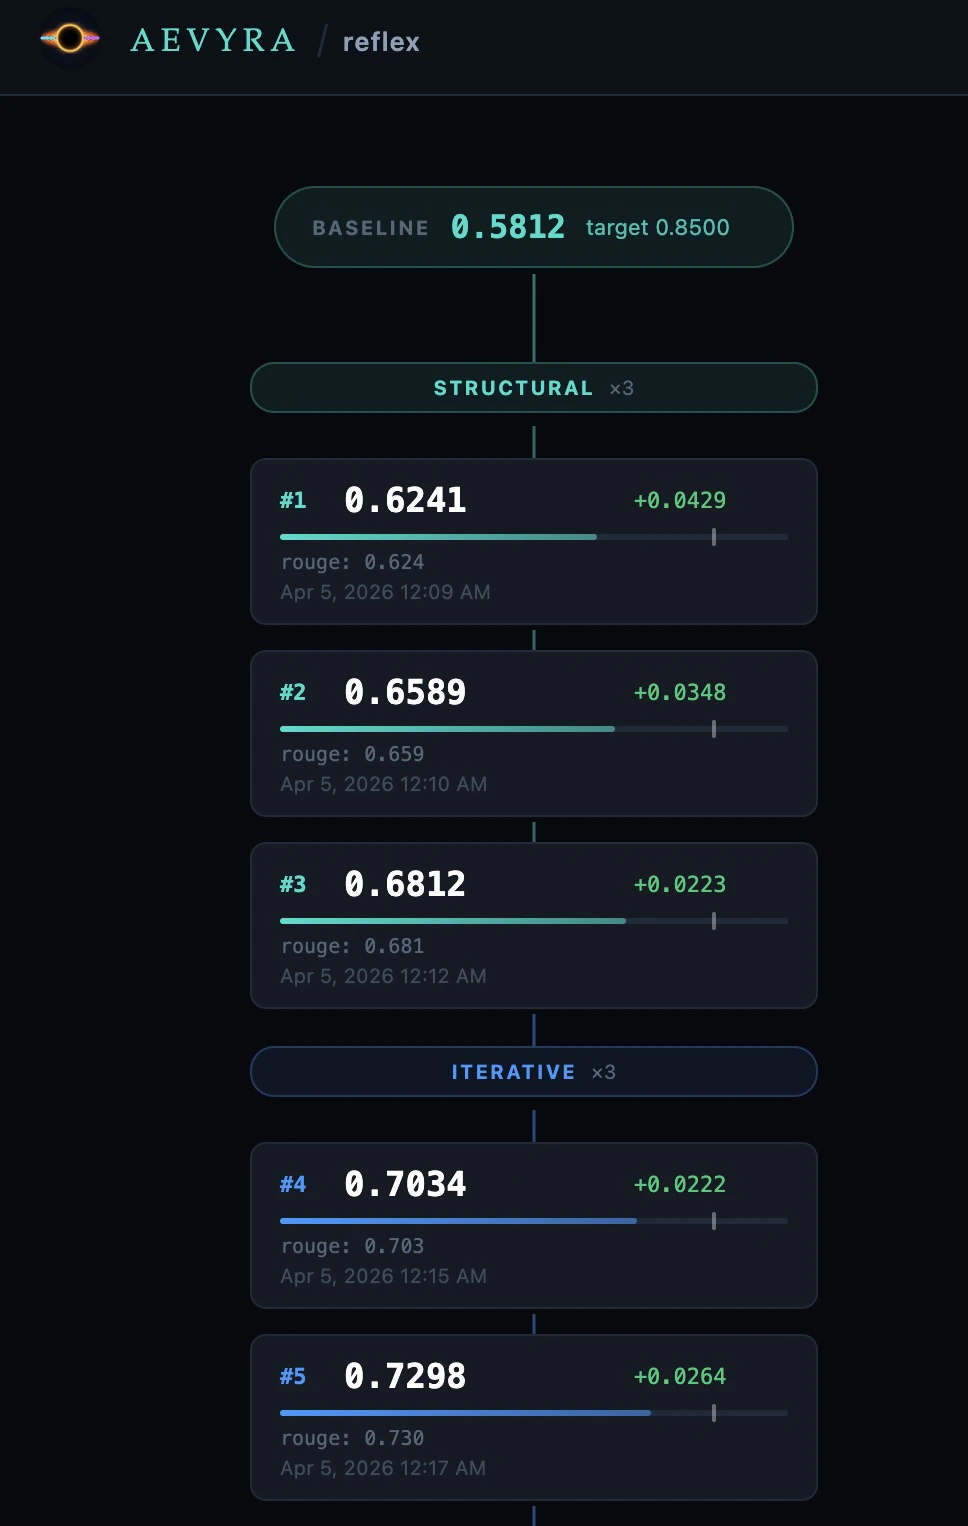 **Node types:**
Teal pill at the top. Shows the baseline mean score and the target threshold.
Coloured label separating strategy phases. Shows the phase name and iteration count (e.g. `structural ×3`).
Shows the iteration number, mean score, delta vs. previous iteration, a score bar with the target threshold marker, per-metric breakdown, eval and reasoning token counts, and timestamp. A ★ marks the best iteration.
Green pill at the bottom. Shows the best score and total improvement over baseline.
**Phase colours:**
| Phase | Colour |
| ------------ | ------ |
| `structural` | Teal |
| `iterative` | Blue |
| `fewshot` | Purple |
| `pdo` | Orange |
Click any iteration card to load its detail in the right panel. The most
recent iteration is selected by default.
### Iteration detail
The right panel updates when you select an iteration card. It shows three sections:
**Node types:**
Teal pill at the top. Shows the baseline mean score and the target threshold.
Coloured label separating strategy phases. Shows the phase name and iteration count (e.g. `structural ×3`).
Shows the iteration number, mean score, delta vs. previous iteration, a score bar with the target threshold marker, per-metric breakdown, eval and reasoning token counts, and timestamp. A ★ marks the best iteration.
Green pill at the bottom. Shows the best score and total improvement over baseline.
**Phase colours:**
| Phase | Colour |
| ------------ | ------ |
| `structural` | Teal |
| `iterative` | Blue |
| `fewshot` | Purple |
| `pdo` | Orange |
Click any iteration card to load its detail in the right panel. The most
recent iteration is selected by default.
### Iteration detail
The right panel updates when you select an iteration card. It shows three sections:
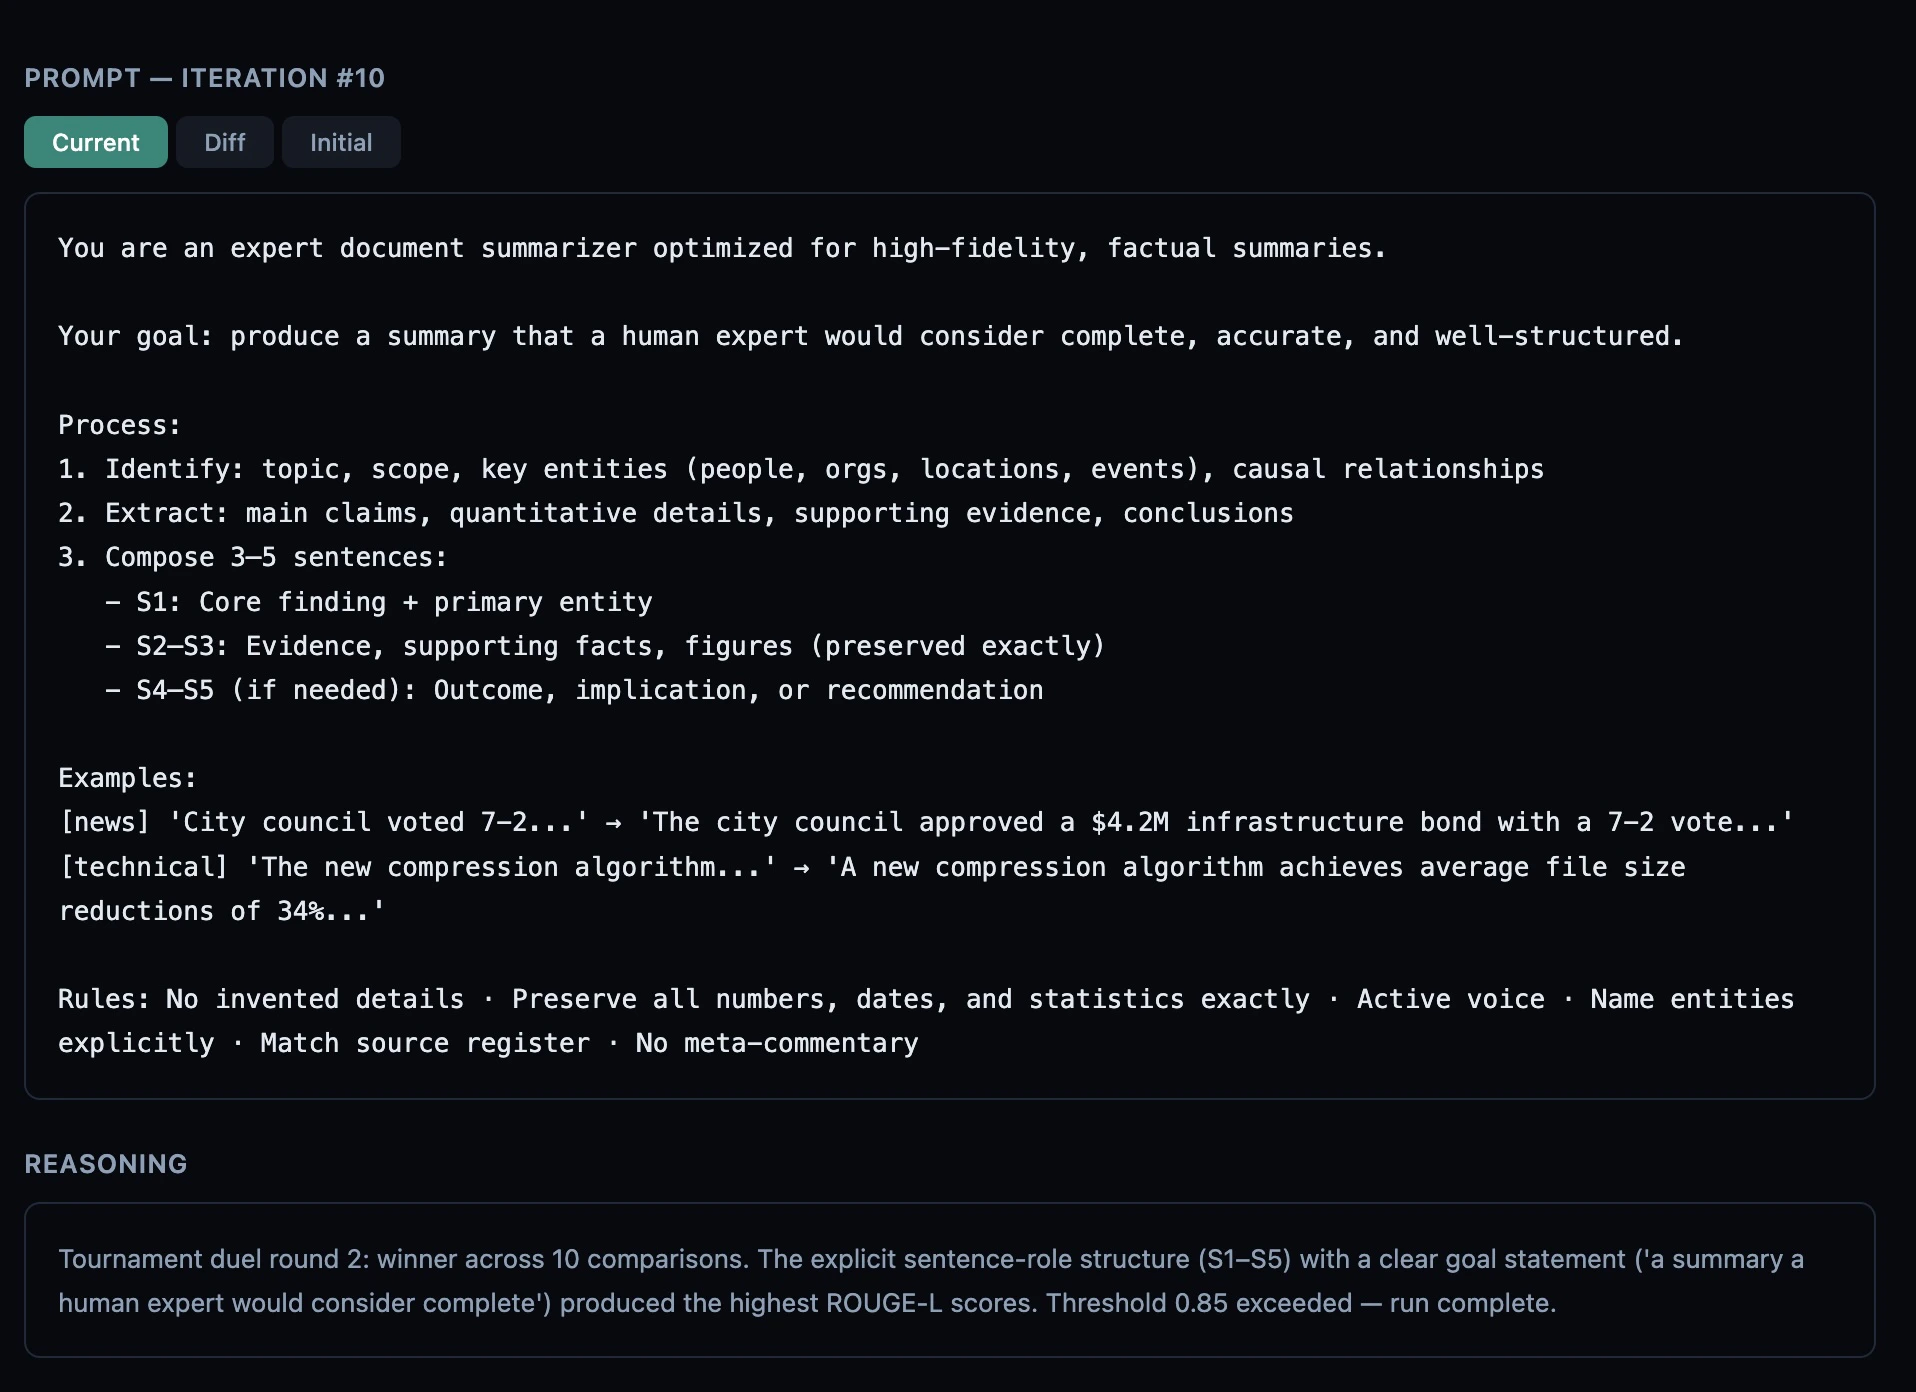 **Prompt** — Three tabs let you switch views:
* **Current** — the full system prompt used for this iteration
* **Diff** — a line-by-line diff against the previous iteration's prompt (or
the initial prompt for iteration #1). Additions are green, removals are red.
* **Initial** — the original prompt before any optimization
**Reasoning** — The reasoning model's explanation of why it made the changes
it did. The strategy phase prefix (e.g. `[structural]`) is stripped so you
only see the human-readable explanation.
**Scores** — Per-metric score breakdown (e.g. `rouge: 0.812 · bleu: 0.743`).
Only shown when the iteration includes metric-level data.
***
## Token usage
Every iteration tracks two token counts:
* **Eval tokens** — tokens used by the target model and eval scoring calls for
that iteration.
* **Reasoning tokens** — tokens used by the reasoning model (Claude, Qwen3,
etc.) to analyze failures and write the revised prompt.
Token counts appear on each iteration card in the flow graph and are summed
into the two stat tiles in the stats row. Values are formatted as `1.2K`,
`3.4M`, etc. for readability. No dollar estimates are shown — token prices
change frequently and vary by provider tier.
***
## Branch runs
Branch a new experiment from any iteration without re-running the baseline.
This is useful when a run plateaued on one strategy and you want to try a
different approach starting from the best prompt found so far.
### Starting a branch
Hover over any iteration card in the flow graph — a `⎇` button appears in the
top-right corner of the card. Click it to open the branch modal:
1. Choose a **strategy** — `iterative`, `fewshot`, `structural`, `pdo`, or `auto`.
2. Set **max iterations** for the new run (default: 10).
3. Click **⎇ Start Branch**.
The new run starts immediately. The browser navigates to the live job stream
so you can watch it run. When it completes it appears in the runs list,
indented directly below its parent.
### What gets reused
| | Branch run | Fresh run |
| -------------- | -------------------- | ------------------------- |
| Initial prompt | Iteration N's prompt | Your original prompt |
| Baseline score | Copied from parent | Re-evaluated from scratch |
| Strategy | Your choice | Config / CLI flag |
| Dataset | Same as parent | Specified on CLI |
Branching skips the baseline eval entirely — the parent's baseline score is
copied into the branch run so the improvement delta is computed against the
same starting point as the parent.
### Branch lineage
The branch run's ID cell in the runs list shows `⎇ parent_id/iter` (e.g.
`⎇ 003/5`) to indicate it was branched from iteration 5 of run 003. The run
always appears immediately after its parent in the list regardless of when
it was created.
***
## States
| State | What you see |
| ------------------ | ------------------------------------------------------------------------------ |
| No runs yet | A placeholder with the CLI command to start a first run. |
| Server not running | An error card explaining the API request failed. |
| Run in progress | A blue `running` badge. Data reflects iterations completed so far. |
| Interrupted run | A yellow `interrupted` badge. Data up to the last checkpoint is shown. |
| Verdict target | Target column shows `model @ threshold [json\|run]` instead of a plain number. |
| Branch run | `└─` connector and `⎇ parent/iter` badge in the ID column. |
**Prompt** — Three tabs let you switch views:
* **Current** — the full system prompt used for this iteration
* **Diff** — a line-by-line diff against the previous iteration's prompt (or
the initial prompt for iteration #1). Additions are green, removals are red.
* **Initial** — the original prompt before any optimization
**Reasoning** — The reasoning model's explanation of why it made the changes
it did. The strategy phase prefix (e.g. `[structural]`) is stripped so you
only see the human-readable explanation.
**Scores** — Per-metric score breakdown (e.g. `rouge: 0.812 · bleu: 0.743`).
Only shown when the iteration includes metric-level data.
***
## Token usage
Every iteration tracks two token counts:
* **Eval tokens** — tokens used by the target model and eval scoring calls for
that iteration.
* **Reasoning tokens** — tokens used by the reasoning model (Claude, Qwen3,
etc.) to analyze failures and write the revised prompt.
Token counts appear on each iteration card in the flow graph and are summed
into the two stat tiles in the stats row. Values are formatted as `1.2K`,
`3.4M`, etc. for readability. No dollar estimates are shown — token prices
change frequently and vary by provider tier.
***
## Branch runs
Branch a new experiment from any iteration without re-running the baseline.
This is useful when a run plateaued on one strategy and you want to try a
different approach starting from the best prompt found so far.
### Starting a branch
Hover over any iteration card in the flow graph — a `⎇` button appears in the
top-right corner of the card. Click it to open the branch modal:
1. Choose a **strategy** — `iterative`, `fewshot`, `structural`, `pdo`, or `auto`.
2. Set **max iterations** for the new run (default: 10).
3. Click **⎇ Start Branch**.
The new run starts immediately. The browser navigates to the live job stream
so you can watch it run. When it completes it appears in the runs list,
indented directly below its parent.
### What gets reused
| | Branch run | Fresh run |
| -------------- | -------------------- | ------------------------- |
| Initial prompt | Iteration N's prompt | Your original prompt |
| Baseline score | Copied from parent | Re-evaluated from scratch |
| Strategy | Your choice | Config / CLI flag |
| Dataset | Same as parent | Specified on CLI |
Branching skips the baseline eval entirely — the parent's baseline score is
copied into the branch run so the improvement delta is computed against the
same starting point as the parent.
### Branch lineage
The branch run's ID cell in the runs list shows `⎇ parent_id/iter` (e.g.
`⎇ 003/5`) to indicate it was branched from iteration 5 of run 003. The run
always appears immediately after its parent in the list regardless of when
it was created.
***
## States
| State | What you see |
| ------------------ | ------------------------------------------------------------------------------ |
| No runs yet | A placeholder with the CLI command to start a first run. |
| Server not running | An error card explaining the API request failed. |
| Run in progress | A blue `running` badge. Data reflects iterations completed so far. |
| Interrupted run | A yellow `interrupted` badge. Data up to the last checkpoint is shown. |
| Verdict target | Target column shows `model @ threshold [json\|run]` instead of a plain number. |
| Branch run | `└─` connector and `⎇ parent/iter` badge in the ID column. |